
Salon reporting and analytics

See What Is Working. Know Where to Act Next.

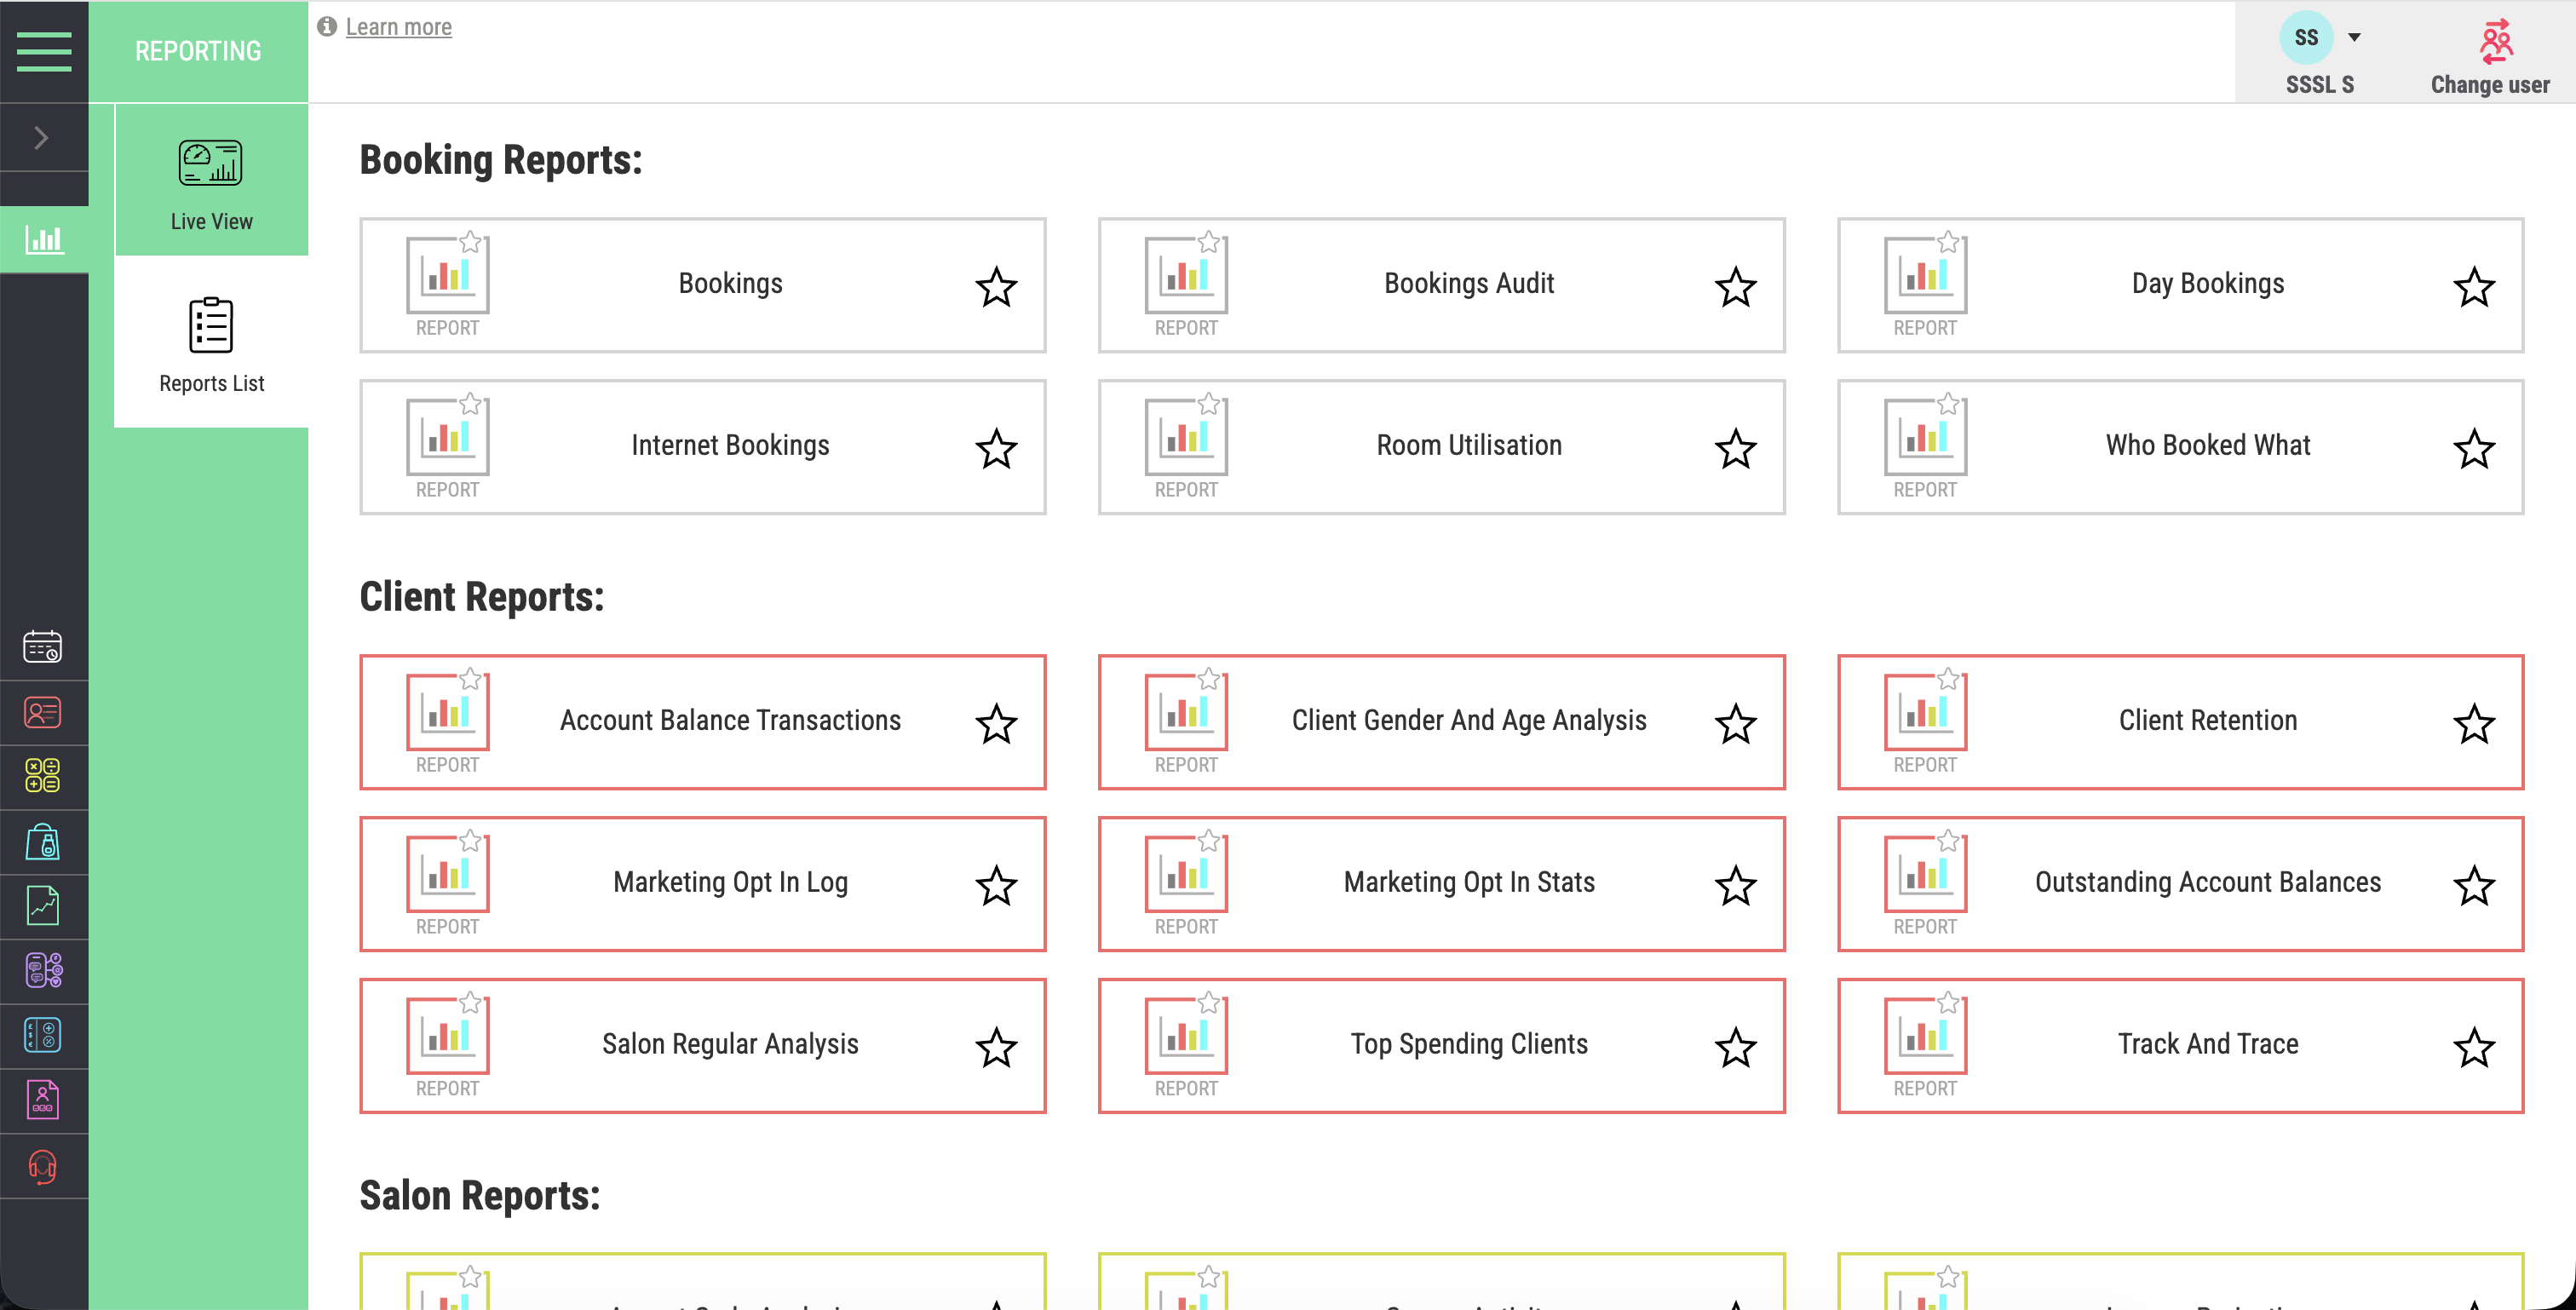
See revenue, diary use, retention, retail, stock, team and location performance in one connected view. Spot changes earlier and turn the numbers into a clear next action.

Tailored demonstration • UK-based onboarding • Support after launch

Revenuecurrent trading activity
Diaryutilisation and booking trends
Clientsretention and rebooking
Group viewsalon to location reporting

Your salon activity, turned into useful next steps

Find the Opportunity Hidden Inside the Working Day

Move from today’s trading position to the detail behind it. Compare services, diary capacity, clients, team members, products and locations without rebuilding reports by hand.

See today clearly

See Today’s Trading Position Before the Day Is Over

Review appointments, service revenue, retail and daily activity from one connected dashboard while the day is still moving.

Understand every revenue stream

Understand Which Revenue Streams Are Driving the Result

Review service revenue, retail, gift vouchers, memberships, packages and payment activity together. See how each stream contributes to the wider result.

Make every bookable hour visible

Measure How Bookable Time Is Being Used

Review peak periods, popular services, booking patterns and diary utilisation. A full-looking diary does not always show where capacity is being used well.

Lead with clearer evidence

Give Team Performance Conversations Better Context

Review productivity, completed appointments, revenue, commission and retail activity together. Use the figures as context for fairer, more useful conversations.

Understand the health of client relationships

See Whether Good Visits Are Becoming Return Visits

Track repeat visits, rebooking, loyalty activity and retention trends. See where strong service is building a longer client relationship.

Reporting shaped around your priorities

Change the Time Period Without Losing the Business Context

Review daily, weekly, monthly and longer-term periods around the questions that matter. Compare like with like before acting on a change.

Show Me the Numbers That MatterCompare Packages →

See what is creating the commercial result

See Which Services, Products and Client Behaviours Drive Revenue

Review services, retail, vouchers, memberships, packages and payments together. Understand what contributes to revenue and where the next opportunity may sit.

Service revenue by categorySee which services and categories are making the strongest contribution to revenue.
Retail sales and opportunityReview product sales, buying patterns and where retail opportunity may be underused.
Vouchers, memberships and packagesTrack gift voucher, membership and package activity as part of the wider revenue picture.
Payments and daily totalsKeep payment activity and daily totals easier to review and reconcile.
See What Is Driving My RevenueExplore All Features →

Understand performance through people and loyalty

Connect Team Activity With the Client Behaviour Behind It

Review individual and team activity alongside client behaviour. Understand productivity, retention, rebooking and longer-term engagement in the same context.

Revenue contribution by team member

Compare service and retail revenue across individuals, roles or teams.

Productivity across the diary

Review completed appointments, utilisation and productivity trends over time.

Retention that can be measured

See how consistently clients return and where retention may be strengthening or slipping.

The next appointment made visible

Track whether clients are leaving with the next appointment already secured.

One business view across every site

Compare Locations Without Manually Combining Their Reports

Multi-location reporting gives groups one connected view across sites, teams and overall performance. Compare results without manually combining separate reports.

Performance by individual location
Revenue visibility across the group
Comparable team performance
Consistent reporting for every site
A stronger basis for long-term planning
Make Multi-site Reporting EasierExplore Multi-location →

Questions buyers ask

Straight answers about salon reporting and analytics

Which areas can Salon Manager reporting cover?
Reporting can cover revenue, diary activity, team performance, client retention, rebooking, retail, stock and multiple locations, depending on the selected configuration.
Can I compare individual team members or locations?
Supported reports can help authorised users compare relevant team, salon, region or group-level activity using a consistent reporting structure.
Does Salon Manager replace financial or professional advice?
No. Reports support operational decisions, but the business remains responsible for definitions, data quality, interpretation and any accounting or professional advice it requires.
How current is the reporting information?
Salon Manager uses activity recorded within the connected platform. The usefulness of each report depends on accurate, timely and consistent records.
Can you demonstrate reports using our priorities?
Yes. A tailored demonstration can focus on the measures your business currently reviews and the questions leadership needs to answer.

Turn salon activity into useful insight

Turn clearer numbers into more confident decisions.

Understand revenue, bookings, retention, retail, team performance and stock without assembling separate spreadsheets.

Book My Tailored Demo

Friendly, clear and without pressure

Update cookies preferences